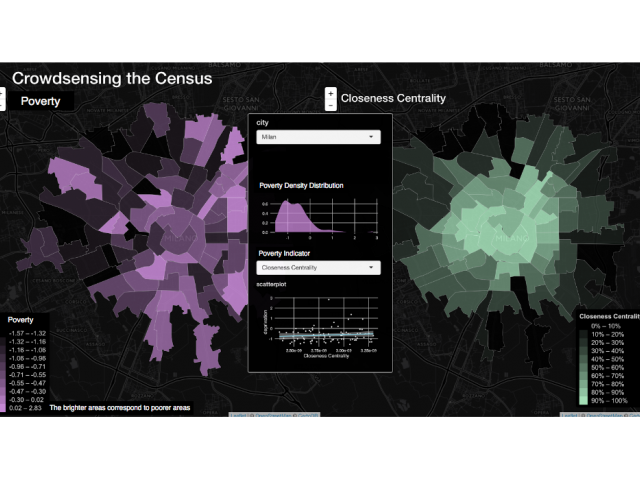
"Poverty maps" are designed to simultaneously display the spatial distribution of welfare and different dimensions of poverty determinants. The plotting of such information on maps heavily relies on data that is collected through infrequent national household surveys and censuses. However, due to the high cost associated with this type of data collection process, poverty maps are often inaccurate in capturing the current deprivation status. In this paper, we address this challenge using a methodology that relies on alternative data sources from which to derive up-to-date poverty indicators, at a very fine level of spatial granularity. We validate our methodology for the city of Milano and demonstrate how it could be used to implement a poverty mapping tool for policy-makers.
This project has been conducted as one of the major projects at the 2016 Data Science for Social Good (DSSG) summer program at the University of Washington's eScience Institute. I am grateful to have the opportunity to work on this project -- I learned a lot from our great mentors Dr. Afra Mashhadi and Dr. Ariel Rokem, and also from my colleagues Rachael, Carlos, and Imam.
The abstract has been invited for an oral presentation at the NetMob conference.
Lee, M., Dottle, R., Espino, C., Subkhan, I., Rokem, A., & Mashhadi, A. (2017). A tool for estimating and visualizing poverty maps. In NetMob 2017. Retrieved from http://netmob.org/assets/img/bookofabstract_oral_2017.pdf