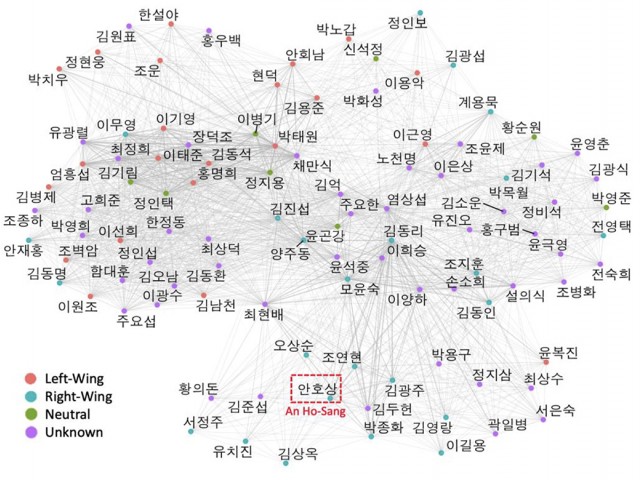
This study leverages network modeling methodologies to examine the distribution of political inclinations in Korean middle school language textbooks from 1945 to 1953. The textbooks included in this study are 82 textbooks, where 37 of which from the U.S. military government period (1945-1948), 30 of which from the South Korean government establishment period (1948-1950), and 15 of which from the wartime period (1950-1953). Literature textbooks are excluded from this study due to their inherent nature of containing more writings by contemporary authors, which could present biases in political leaning within the language arts field. We curated the textbook data by combining the list of past textbooks organized in various previous studies (Oh, 2009; Park, 2012; Heo, 2013) and additional books directly found from the National Library of Korea (https://nl.go.kr) and the National Museum of Korea (https://emuseum.go.kr).
Specifically, we constructed a contributor co-occurrence network using six sample textbooks published between 1947 and 1952). Assuming that contributors to a textbook are more likely to invite others who share similar political views, we initially create a network of contributors based on their co-occurrences in textbooks. Each contributor is then represented as a vector of co-occurrences with all other individuals. We calculate the distance between two contributors based on the inversed cosine similarity between their vectors. These pairwise distances form the basis for calculating political inclination scores. We establish An Ho-Sang as the baseline right-wing individual (so we set his political leaning score as 1), acknowledging his status as a well-known far-right-wing author with political influence (Lee, 2005). Other contributors’ political leaning scores are then calculated by subtracting their inversed cosine similarity values from 1. Finally, we standardize the range of scores so that the scores vary between 0 and 1. To validate this method, we compared the resulting scores against known political leanings—left-wing, right-wing, or neutral—that were manually assigned (“unknowns” are removed in the validation). Figure 2 presents boxplots that compare known political leanings with the calculated scores. The differences in scores are statistically significant across the groups, as determined by ANOVA (F[2, 51] = 21.96, p < 0.001), confirming the method's validity.